Sharing R output online
Example for Monday, July 24, 2023–Tuesday, July 25, 2023
Publishing your stuff online
Quickest and easiest way: RPubs
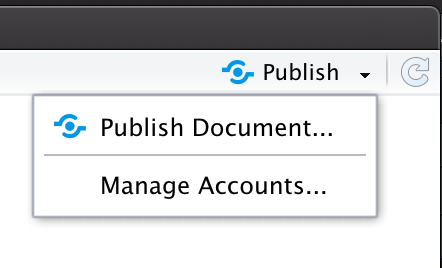
The easiest way to get a knitted R Markdown onto the internet is to use RPubs. We talked about this in session 10, and you used it to turn in exercise 10. After knitting an HTML document in RStudio, click on the “Publish” button in the top right corner to upload the document to the RPubs server and get a URL that you can share with others:
You don’t have to set up a web server or anything—it’s all pretty automatic and seamless.
Great for standalone projects: R Markdown websites
If you have something slightly more complex, like a collection of R Markdown files that do related things, it’s easy to stitch them all together in an R Markdown website. RStudio supports these automatically—after telling RStudio to consider an RStudio project to be a website, it will knit all the .Rmd files in the root of your project directory every time you click on the “Build Website” button.
RStudio generates a standalone folder named public with static HTML pages of all your knitted documents. You then have to put that folder on the internet somewhere, either on a web server you have access to, or a free service like Netlify.
See this page for complete documentation, or follow these tutorials by Lucy D’Agostino McGowan and Emily Zabor.
These websites are especially helpful for standalone projects like research papers and reports. I’ve had students do their master’s capstone projects with these, with specific pages for their introduction, literature review, data cleaning, exploratory data analysis, modeling, and results.
I typically make a website for each of my research projects and will include pages with IRB details, copies of survey experiments, data cleaning, results, and so on. Here are some examples:
- NGO Crackdowns and Philanthropy
- Are Donors Really Responding?
- The Power of Ranking
- Constraint Closure
You can also make really neat small websites like Desirée De Leon’s Teacup Giraffes for teaching basic statistics.
More complex blogs and websites: blogdown
If you want more control (i.e. total control) over the HTML output and the structure of a website, you can use a package named {blogdown} to convert R Markdown files into an entire website. This course website is built with {blogdown}: you can see all the underlying R Markdown files at GitHub.
Like R Markdown websites, blogdown generates a complete static version of the knitted website and puts it in a folder named public. You’re then responsible for putting that somewhere on the internet, either on your own server or by using a free hosting service like Netlify.
Blogdown is incredibly well documented, and there are lots of tutorials for how to get started. Alison Hill’s tutorial here is the best place to get started—follow it and you’ll have a basic blog completely free.
Books, dissertations, and theses: bookdown
If you don’t want to create a website, you can use a package named {bookdown} to stitch a collection of R Markdown files into a PDF, Word, or HTML book. (You could even put all your exercises from this class into a single book!). {bookdown} is incredibly well documented too (as a {bookdown} book), and you can get familiar with it fairly quickly.
Dozens of real-world books, dissertations, and theses have been written with {bookdown}, including both Claus Wilke’s and Kieran Healy’s books from this course. Because of the magic of Markdown, you can create parallel HTML and PDF versions of your book and post one type of output on the internet and print and bind the other one.
Slides: xaringan
R Markdown isn’t just for PDF, Word, and HTML documents. You can also make slides! All the slides for this course were made in R Markdown with a package named {xaringan}. You can see the documentation here, and see the main example presentation here. You can also see all the R Markdown files I wrote to create the slides for this class here.
Code: GitHub and GitHub gists
And finally, if you want to share code (and keep track of versions of your code), GitHub is one of the best places for that. Posting your code at places like GitHub lets other people see and borrow and adapt and make suggestions to your code. You can see all my different repositories and projects here, for example.
Jenny Bryan has a useful {bookdown} website explaining how to get started, and GitHub itself has excellent materials for learning how to use git.
If you don’t want to go through the process of creating a full-blown git repository, GitHub also lets you make “gists”, which are single shareable files of code. (See all mine here for examples). Gists are excellent ways to share reproducible examples (or reprexes), and the {reprex} package in R generates output that you can paste directly into a new gist for sharing (see this one, for instance, which I used to show someone how to run and plot logistic regression with R).
Telling stories with data
If you’re interested in learning more about data storytelling and science communication, check out these resources:
- BUSM 491R: Telling Stories with Data (BYU, Fall 2017)
- Cole Nussbaumer Knaflic, Storytelling with Data: A Data Visualization Guide for Business Professionals (Hoboken, New Jersey: John Wiley & Sons, Inc., 2015).
- Alan Alda, If I Understood You, Would I Have This Look on My Face? My Adventures in the Art and Science of Relating and Communicating (New York: Random House, 2017).
- Nancy Duarte, Resonate: Present Visual Stories That Transform Audiences (Hoboken, New Jersey: John Wiley & Sons, Inc., 2010).
- “Understanding the way scientists speak,” MSNBC Morning Joe, 2013-04-24
- “Improvisation for Scientists: Workshops by Alan Alda and the Center for Communicating Science,” Stony Brook Journalism, 2010-03-23